|
|
Your source of photonics CAD tools | |
|
| ||
PICWaveA photonic IC, laser diode and SOA simulator |
    |
Mode-locked laser diodeSimulation with PICWave softwarePICWave can model a large variety of semiconductor lasers. We will show here how it can be used to simulate a mode-locked laser diode.
Design of the mode-locked laser cavity Design of the mode-locked laser cavityIn this device mode-locking relies on a saturable absorber. Both the laser and the saturable absorber are located within the laser cavity. The saturable absorber is modelled in PICWave by a gain section with a very short non-radiative recombination time.
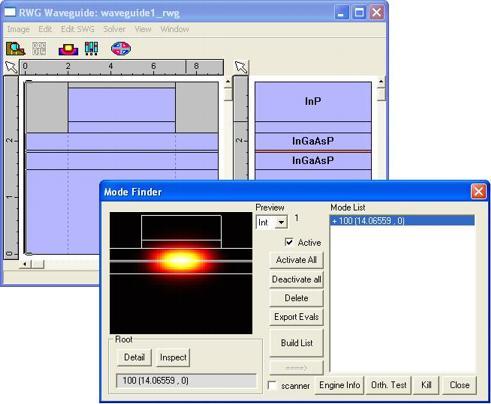
The laser is defined by a 2D cross-section. The gain spectrum can be obtained in different ways, either defined manually or imported from a hetero-structure model such as Harold. An example of importation of gain curves from Harold with Wide-Band Gain Fitting can be seen here. The passive modes of the laser are calculated with a fully vectorial XY mode solver: the FDM Solver. Numerous mode parameters can be calculated, including the effective index, group index and dispersion, as well as the confinement factor.
Simulation of the mode-locked laser in the time-domainThe laser is modelled by PICWave in the time-domain. The laser is started from amplified spontaneous emission. You can see below the output of the laser in the time domain. You can clearly observe the Q-switching occurring at the beginning of the simulation. After 1.5ns, the mode-locked laser reaches its steady state. Zooming on the steady-state, you can observe the expected train of Gaussian-like pulses, with a spacing of 16ps and a FWHM of 4ps.
Output of the mode-locked laser in the frequency domainThe spectrum in the frequency domain is calculated for the steady-state. Zooming on a wavelength range of 10nm, you can clearly see the expected narrow mode lines with an overall approximately Lorentzian envelope profile. The wavelength spacing is 450pm, which corresponds to the expected value (cavity length: 640um, central wavelength: 1.475um, group index: 3.72).
|
 © 2023 Photon Design copyright all rights reserved |

 |